
Simple bandstructure calculation
This tutorial uses results of previous tutorial Please first run the calculations of:
and then copy the results here.
cp -r ../F5/MoS2 . ; cd MoS2
Calculating a band structure
We perform a band structure calculation in the bands folder. Create and change into that directory.
mkdir bands ; cp * bands/ ; cd bands
This requires the choice of a k-point set for the calculation that is a path along high-symmetry lines in the Brillouin zone. For most unit cells the Fleur input generator by default constructs such a k-point path and stores it in the kpts.xml file. To get a list of the names of the k-point sets stored in kpts.xml use the command grep name kpts.xml. The output should be similar to
            <kPointList name="default" count="30" nx="10" ny="10" nz="1" type="mesh">
            <kPointList name="path-2" count="240" type="path">
grep name kpts.xml
In these lines one does not only see the name of each k-point set but also the number of k-points in it (count) and its type. Here we have a k-point path named "path-2" consisting of 240 k-points. For the purpose of the tutorial we want to use a k-point path with less points. To add new k-point sets to the kpts.xml file the input generator has the command line option -kpt. We construct another k-point path along the same high-symmetry points as the default path with only 60 points by invoking inpgen with
inpgen -inp.xml -kpt band=60
The -inp.xml option hereby specifies that inpgen reads in input from an inp.xml file in contrast to a conventional inpgen input. With these command line options the input generator will provide the following terminal output on the stored k-point sets:
 Stored k-point lists:

                NAME           TYPE      NKPT   COMMENT
 ================================================================================
             default           MESH        30   10 x 10 x 1
              path-2           PATH       240   g - M - K - g
              path-3           PATH        60   g - M - K - g
 ================================================================================
Obviously we now have an additional k-point path "path-3" with 60 points along .
Sidenote: One may also want to make other k-point sets available for other reasons, e.g., one wants to converge the density with respect to the size of the k-point set or one wants to use different high-symmetry points to define a k-point path. For a list of options available to create a user-specified k-point set see the respective section within the inpgen reference.
To set up the band structure calculation two modifications have to be made in the inp.xml file:
- The desired k-point path has to be selected. For this we set
/cell/bzIntegration/kPointListSelection/@listNameto "path-3". - The switch activating a band structure calculation (
/output/@band) has to be set to "T". - Not in this tutorial, but in general it may also be advisable to explicitly define the number of Kohn-Sham states to be calculated at each k-point. For this
/calculationSetup/cutoffs/@numbandshas to be set to a finite value. A value of tells Fleur to automatically determine a default value large enough to calculate to charge density, but for band structure calculations this may imply only very few unoccupied bands in the band structure.
Open an editor and modify the inp.xml file as sketched above.
After performing these changes we can invoke Fleur to actually perform the band structure calculation.
fleur_MPI
Doing this will yield several new output files:
bands.X(X=1 for nonmagnetic calculations, otherwise also X=2 for the two spins): This is a list of the data points to be plotted in the band structure with x-coordinates in the first column and energy eigenvalues in eV in the second column.band.gnu: This is a gnuplot script to plot the data inbands.X.banddos.hdf(only if Fleur is compiled with HDF5 support): In this file also the whole band structure with all needed data is available in an HDF5 file format. Additionally several weights are stored here to indicate, for example, projections onto certain angular momenta within the MT spheres.
One also obtains an important terminal output:
 Fermi energy correction for insulators:
 Fermi energy in bands.* files has been set to the maximal
 value determined in the band structure calculation and
 the calculation of the underlying density, respectively.
This output tells the user what an energy eigenvalue of in the bands.X file means.
To use the gnuplot script we invoke gnuplot < band.gnu > bands.ps followed by ps2pdf bands.ps to create a PDF file with the band structure.
gnuplot < band.gnu > bands.ps
ps2pdf bands.ps
Download and display the created file bands.pdf For the finer k-point path "path-2" the resulting band structure is provided in the following plot. For "path-3" the points should be slightly more separated.
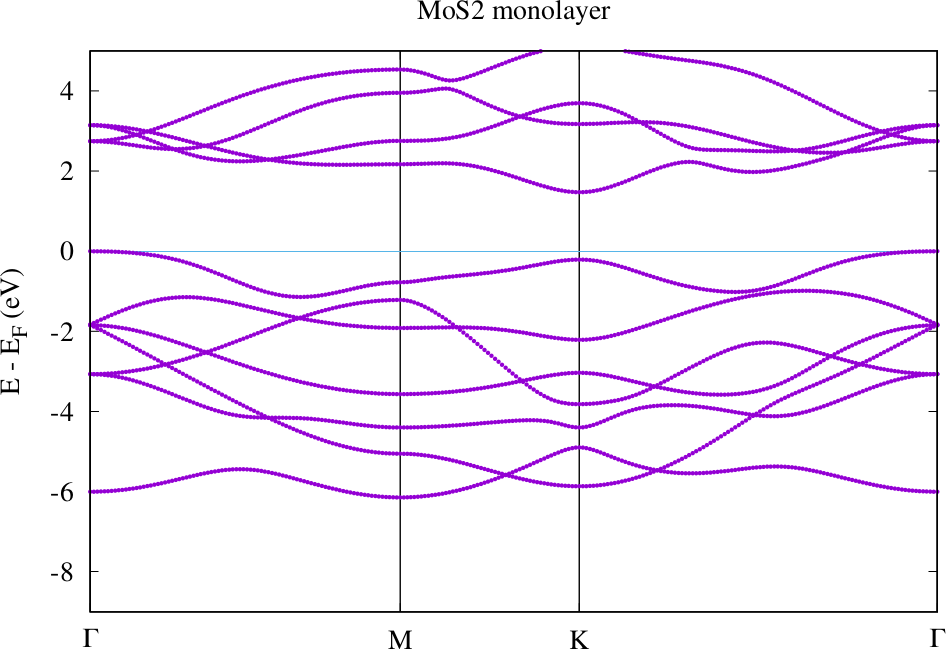
Band structure for MoS2 monolayer with default geometry as provided above.