
Band unfolding
Fleur includes the ability to unfold the band structure (see e.g.
O. Rubel, A. Bokhanchuk, S. J. Ahmed and E. Assmann, Unfolding the band structure of discordered solids: from bound states to high-mobility Kane fermions, Physical Review B 90, 115202 (2014))
of a supercell calculation to the one of a primitive unit cell. This feature is controlled by a seperate flag within the output section.
In this section the size of the supercell has to be specified (in multiples of primitive unit cells).
Unfolding the band structure can only be used when the flag for a band structure calculation (/output/@band) is set.
When the boolean flag /output/unfoldingBand/@unfoldBand is set to T, two band structures are calculated.
The band structure of the provided cell (supercell) and a band structure for the primitive cell, meaning the backfolded band structure, is written out.
Fleur then creates additional output files (band_sc.1, band_sc.2 and band_sc.gp) with the same usage as described for the normal
band structure calculation. The gnuplot file can be used directly to plot the backfolded band structure.
Additionally the information is also written to the banddos.hdf file. There it can be used for other plotting tools.
This allows for additional analysis, for example the combination of band unfolding and band character weight is then possible to plot.
The calculation can only run with a number of points for the band structure that is a multiple of the number of mpi threads. This is checked at the beginning of the calculation, if the associated error message is displayed, please adapt your parallelisation or number of points accordingly.
It follows an example for a diamond supercell with a single A-nitrogen-center defect. The band unfolding specification in the input file for such a calculation is:
      <unfoldingBand unfoldBand="T" supercellX="4"
                     supercellY="4" supercellZ="4"/>
In the figure below the supercell band structure together with a visualization of the weights obtained for the backfolded band structure are shown along the -point path for the primitive unit cell. The visualization of the weights makes the backfolded band structure clearly identifiable while the supercell band structure is very faint. In addition to this visualization in the band gap the two defect states due to the A-nitrogen-center are highlighted in yellow.
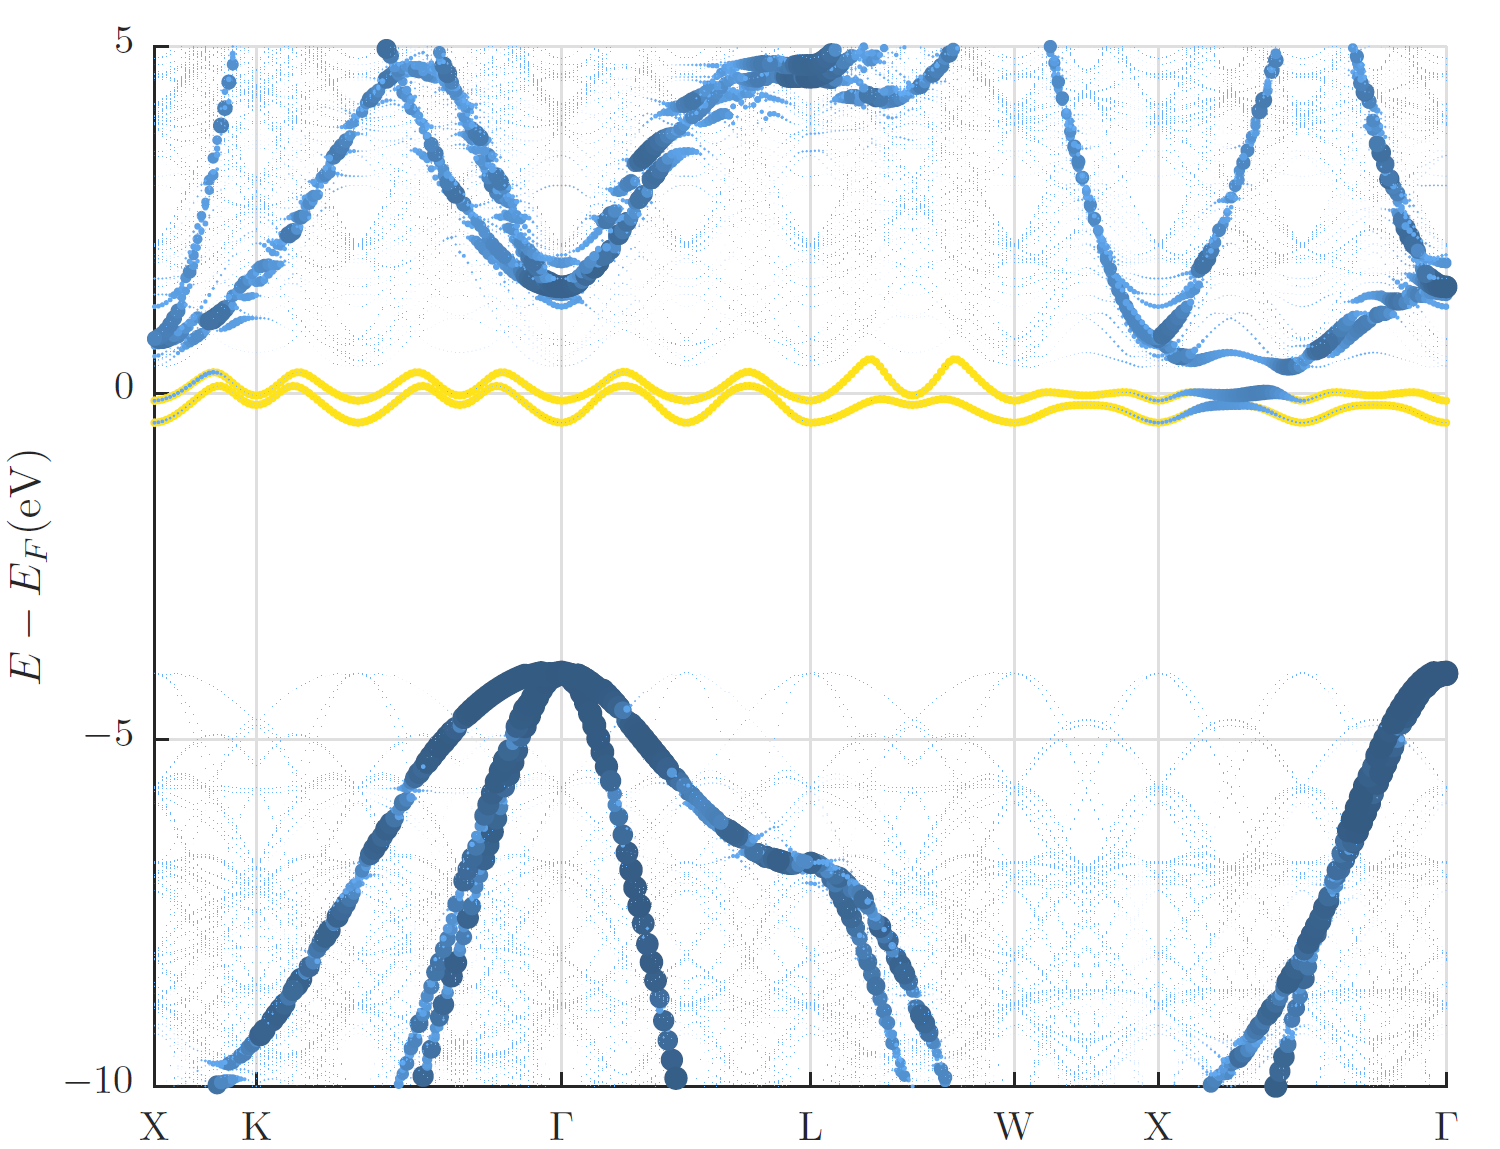
Diamond band structure with A-nitrogen-center defect.