
Obtaining the band structure
The starting point for the calculation of a band structure is a finished Fleur calculation yielding a self-consistent density. This means that a charge density file with this density should be present in the working directory and be consistent with the input file.
The main difference between a band structure calculation and an SCF calculation is that different -point sets have to be used. While a good SCF calculation uses a -point set that representatively samples the Brillouin zone, the -point set for a band structure calculation has the form of a -point path along high-symmetry lines of the Brillouin zone.
The input-generator in most cases creates a -point set usefull for band structures by
default. You can find them in the kpts.xml file with a .../kPointList/@type parameter "path".
In addition you can use the input generator to create further -point sets.
The -point set for a Fleur run is specified by its name
in cell/bzIntegration/kPointListSelection/@listName. For each -point list the name
is specified in .../kPointList/@name, typically in the kpts.xml or directly in the
inp.xml file.
After defining the -point set for the band structure the band-structure calculation has to be switched on.
To start a band strucure calculation with Fleur the output/@band switch has to be set to T. Then
Fleur has to be started in the respective directory. Since every new Fleur run overwrites the old output files
make sure that you create backups of these files before starting the band structure calculation. The data from the
out and out.xml files may be needed in the postprocessing to the band structure calculation.
There are two sets of output files for the bandstructure data.
Simple text file output
The simplest band-structure output is stored in several files:
* The bands.1 (and bands.2) files for the data.
* A bands.gnu file containing a simple gnuplot script to generate the bandstructure.
For nonmagnetic calculations the band structure is stored in the file bands.1 in terms of two columns
with an x coordinate in the first column and an energy in eV in the second column. For magnetic calculations this file
contains the data for the first spin while the data for the other spin is stored in the file bands.2.
Note that the Fermi energy calculated in Fleur depends on the -point set. If the Brillouin zone is well-sampled one obtains a good value for the Fermi energy. -point sets for band-structure calculations are not made for such a Brillouin zone sampling and the quality of the Fermi energy depends on whether the highest occupied state is near the high-symmetry -point path or not. Therefore one has to pay attention to correct the raw band structure data to the correct Fermi energy. This can be performed while plotting the data.
To plot the band structure data Fleur writes out a gnuplot script band.gnu. It can be used by
invoking gnuplot < band.gnu > bands.ps and afterwards converting the postscript file into a
PDF with ps2pdf bands.ps. The correction offset can directly be inserted into the plotting command in the script.
The Fermi energy from the last calculation can be obtained from the out.xml file by invoking
grep FermiEnergy out.xml.
Depending on whether a cdn1 or a cdn.hdf file is used some correction of the Fermi
energy is automatically performed in the raw data. In the case of the cdn.hdf file the energy alignment of
the raw data is already corrected. Details on the correction are written out to the terminal when the band-structure
files are generated. In the case of the cdn1 file it is aligned to the Fermi energy of the band structure
calculation. A Fleur output to the command line will inform you about this.
There are also cases in which the Fermi energy from the band structure calculation is the better choice, i.e., if the highest occupied state is directly on the chosen -point path. But the Fermi energy from the SCF calculation can systematically be converged by choosing ever finer -point meshes.
The following figure shows the band structure for Silicon using the default -point path. It was directly created with the gnuplot script mentioned above. No correction of the Fermi energy had to be performed here because the highest occupied state is located at a point included in the default path.
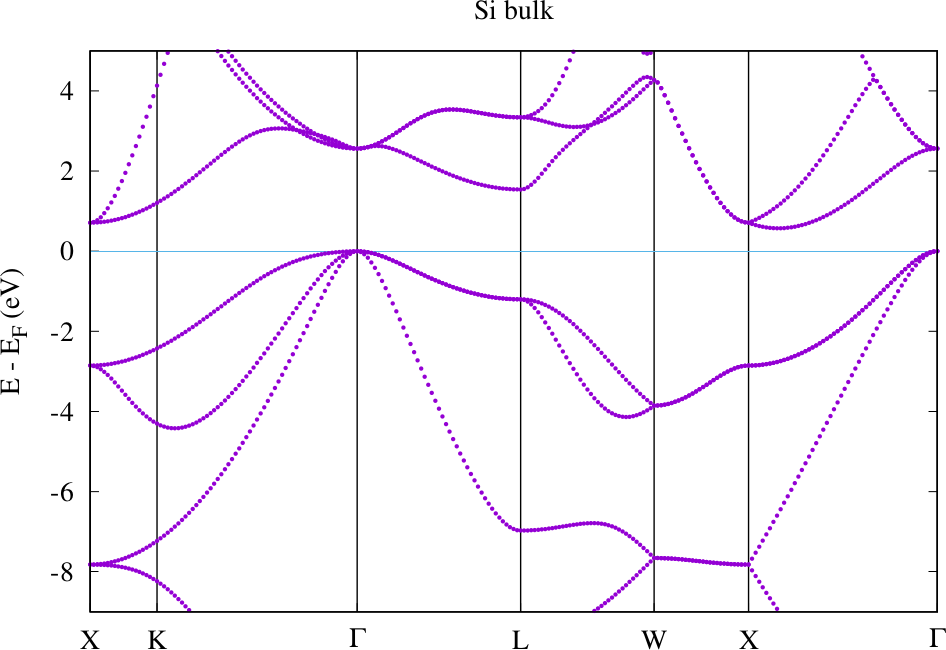
Si band structure
Bandstructure output in the banddos.hdf file
In case the code is linked against the hdf5 library, the banddos.hdf file is written. It contains
all the data needed to create a band structure and also weights for each state that can be used to create band
structures with additional encoded information. The weights available here are the same as those used in the DOS mode.